XpertMatrix™
Chapter Topics
Viewing Stock Data in the XpertMatrix™
Changing the Order of Rows and Columns in the XpertMatrix™
Switching Rows for Columns in the XpertMatrix™
Viewing Stock Data in the XpertMatrix™
The XpertMatrix™ displays the stock on hand
for a certain style in a Color/Store/Size/SecondSize matrix. The XpertMatrix™ offers a dynamic way to quickly see your inventory and
spot where you may be overstocked or understocked. For example, a sales
clerk in a store where the items are sold out, would open the matrix to
see if the sold out item is in stock anywhere else in the chain.XpertMatrix™ is launched by pressing the matrix button on the toolbar
in any catalogue:  .
.
The size of the XpertMatrix™ can be adjusted by
moving the cursor to one of the corners of the window. The contents displayed
automatically adjust to the size of the window; scroll bars will appear
along the bottom and along the right side if the window becomes smaller
than contents being displayed. The width of the columns in the matrix is
configurable and can be adjusted
in the Document Screens Tab
of the Station Configure
menu. You can also adjust the width of any column temporarily by clicking
on the border of the column and dragging it to its desired size. (To temporarily
adjust the width of all columns, press the right button of the mouse and
click on Select All in the menu that appears before adjusting the width of
the column).
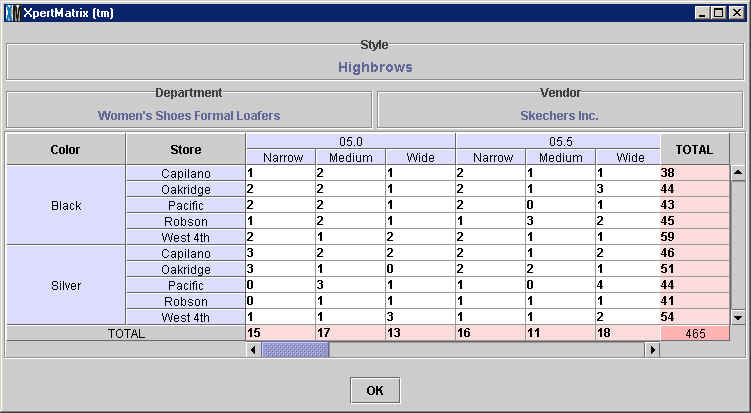
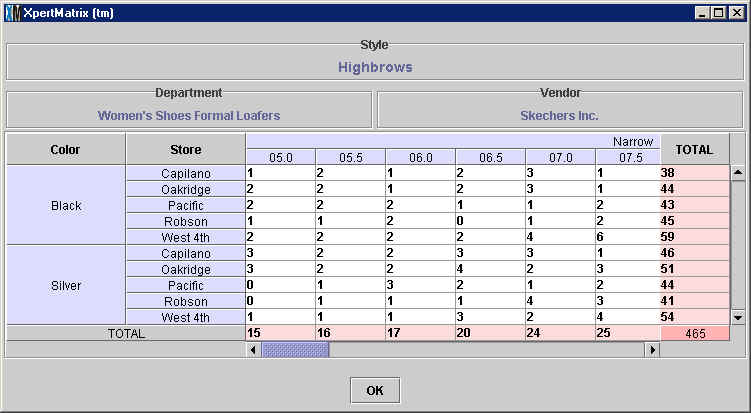
The XpertMatrix™ window shows the name of
the Style at the top (the Highbrows style in the example above) as well as
the Department and Vendor it belongs to. In the basic display, the colors
that the style is available in are displayed in rows along the left. In the
example above, you can see that the Highbrows loafer is available in Black
and in Silver. Also in the vertical axis, next to the Color rows, all of
the stores in the chain are displayed. In this case, there are five stores:
Capilano, Oakridge, Pacific, Robson and West 4th. Along the horizontal axis
you see first the sizes the style is available in, and then the second sizes.
In this case, the Highbrows loafer is available in sizes 5.0 - 10.0 and each
Size comes in one of three Second Sizes: narrow, medium and wide. The Second
Size is optional and many matrices will only show the Size along the horizontal
axis.
Every combination of a color, a store, a size and a second size creates
a cell in the matrix. Every cell in the matrix represents an item and the
number in that cell shows the current stock level for that item. In the
above example, there are currently 3 Silver Size 5.0 Narrow Highbrow loafers
in stock in the Oakridge store and 2 Black Size 5.5 Wide in the Robson store.
When there is a zero in a cell it means the item is out of stock, as is
the case with the Silver Size 5.0 Narrow at both the Pacific and Robson
stores. If a certain Color/Size/SecondSize combination did not exist then
those corresponding cells would appear in gray.
Along the bottom and the right-hand side there are subtotals appearing
in cells shaded pink. The pink cells along the bottom show the total of
a particular Size/SeondSize combination. In the example above, there are
17 Size 5.0 Medium loafers in stock in all five stores in the chain, in
both colors. The pink cells along the right show the total of a particular
Color/Store combination. For example, the image above shows that there are
a total of 59 Black loafers in the West 4th store in all sizes and second
sizes. The cell in the bottom right-hand corner shaded dark pink shows the
aggregate total for the style. In this case, there are a total of 465 Highbrow
loafers available in every size and color throughout the chain.
Changing the order of Rows and Columns in
the XpertMatrix™
The way that the XpertMatrix™ displays data can
be changed to help you get more insight into your inventory. You can change
which information is shown in the horizontal and vertical axes and the order
in which it is shown. In the example we saw above, the XpertMatrix™ was displaying Color/Store combinations in the
vertical axis. You can reverse this order so that the rows show Store/Color
combination by putting the cursor over the Store column and dragging it to
the left of the Color column, as shown below:
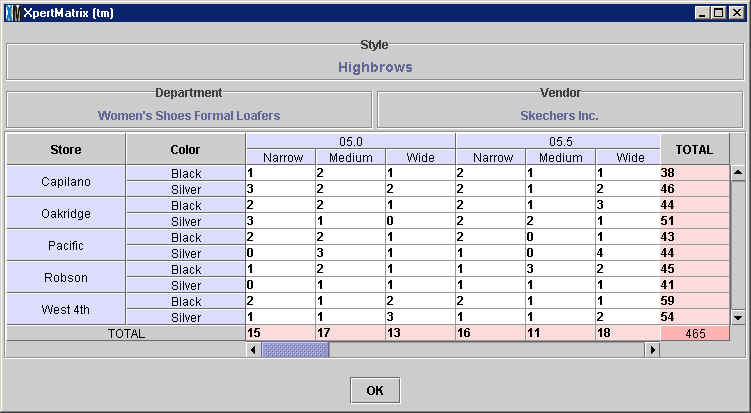
You can now visualize stock information primarily by store. The totals
displayed in the pink column to the right will still match the ones displayed
before (after all, the stock levels have not changed) but the order has
been changed. Notice, for example, that the total number of Silver loafers
in the Capilano store, 46, remains the same, but is now displayed as the
second pink cell from the top and not the sixth from the top as it was before.
The stores and colors are listed in alphabetical order by default. However,
you can move the rows around if it will help you better visualize the data.
For example, if you want to closely compare the stock levels of the Robson
store with those of the Capilano store, you can move the cursor over the
Robson row header, click on it and drag it to the top as shown below:
When you release the mouse button, the Robson store row will be moved
to the new location as shown below:
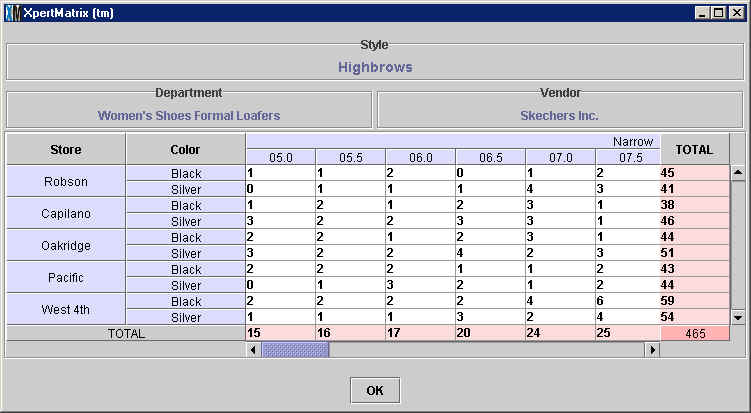
Notice that the two subtotals for the Robson store, 45 for Black and 41
for Silver, have been moved up to the top along with
the stock levels for every Size/SecondSize combination.
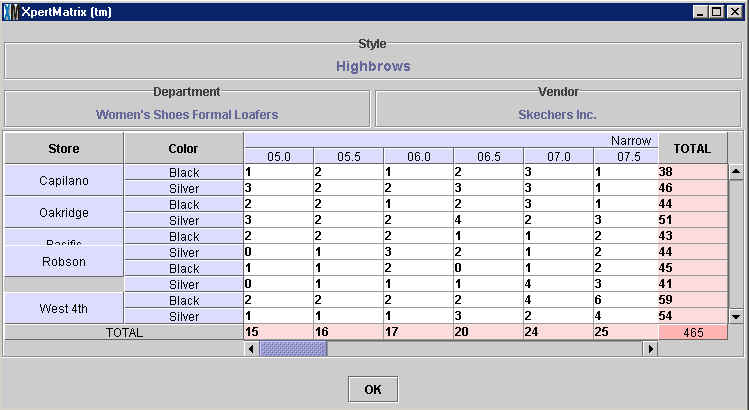
The same kind of rearrangement can be done on the horizontal axis. In
the XpertMatrix™ basic display that was shown in the
beginning, the matrix showed Size/SecondSize combinations on the horizontal
axis. You can reverse this order so that the columns show SecondSize/Size
combinations by putting the cursor over the Second Size header and dragging
it to the top of the Size header, as shown below:
The XpertMatrix™ now shows the stock data by SecondSize/Size
pairs: all of the Narrow sizes are shown first, followed by the medium sizes
and so on. The totals displayed in the pink row at the bottom will still
match the ones displayed before, but the order has changed.
Sizes are displayed in alphanumeric order form left to right by default.
However, just as you are able to rearrange the order of the rows on the
vertical axis, you can move the columns around to help you better understand
the data. For example, if you want to closely compare the stock levels in
Size 7.5 Narrow with those in the Size 5.0 Narrow, you can move the cursor
over the Size 7.5 Narrow column header, click on it and drag it to the left
as shown below:

The Size 7.5 Narrow stock column is now next to the Size 5.0 Narrow stock
column for easy comparison. Notice that the total in pink (25 pairs) has
also moved.
Switching Rows for Columns in the XpertMatrix™
The way the XpertMatrix™ displays stock data can
further be modified by switching the information that is displayed in the
horizontal axis to the vertical axis and vice-versa. This function is particularly
useful if you want to isolate one of the four dimensions (Color, Store, Size
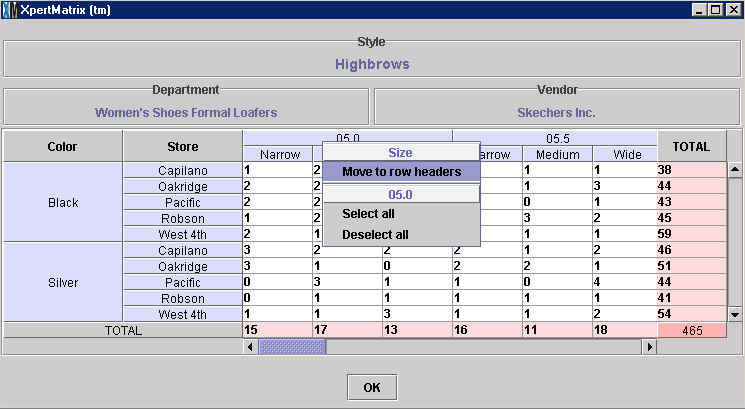
and SecondSize for closer inspection). For example, you can move the Size
column and make it a row. To do this, move the cursor over any Size header
and right-click. You will see a small menu open up; select the Move to row
headers option as shown below:
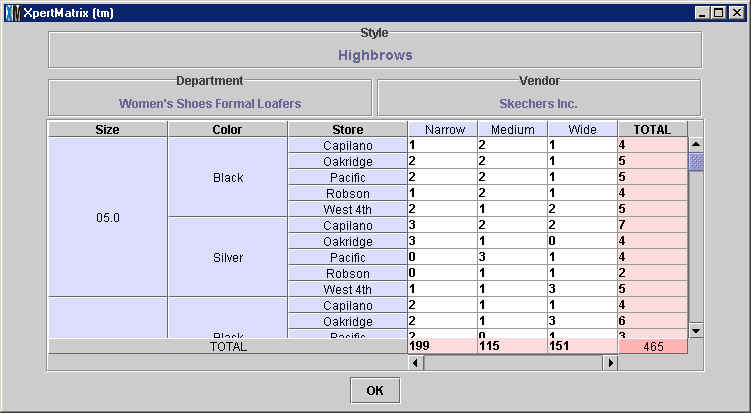
The Size will now appear as a row, alongside the Color and Store rows.
This is a useful way to isolate the SecondSize dimension as you can now
see subtotals for Narrow (199), Medium (115) and Wide (151).
As discussed in the previous section, you can change
the order in which the rows arranged. In the example above, the information
along the vertical axis is predominantly orderd by Size. However, you could
rearrange the display so that the information is primarily displayed by Store
by clicking on the Store column header.
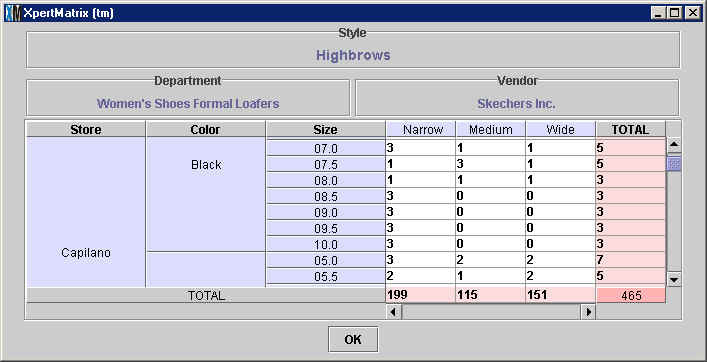
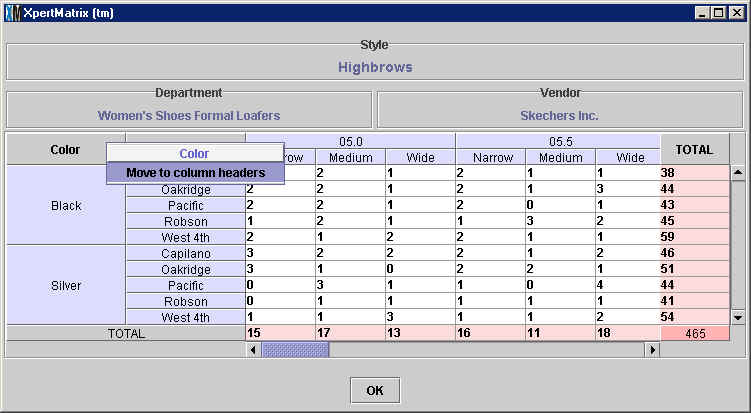
Similarly, any column can become a row. To do this, right-click over any
row header and select the Move to column headers option in the menu that
appears. In the example below, the Color row is being moved to a column.
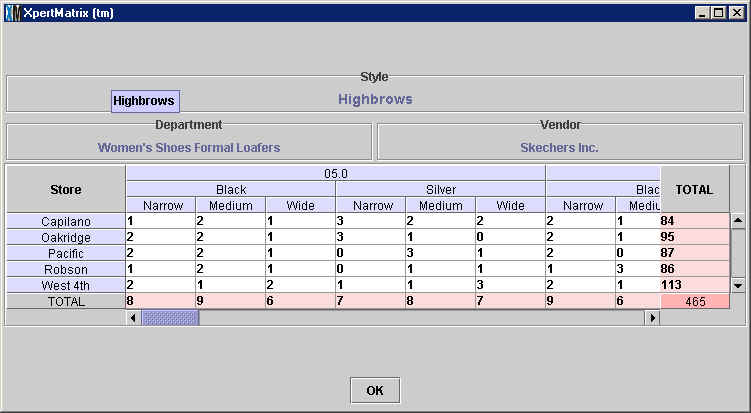
The total stock levels for each store have now been isolated. You can
now see, for example, that the West 4th street has a lot more stock than
the other four stores. If each store had received the same number of Highbrows
loafers, this might be a matter of concern. The point is that by changing
the way information is displayed, a new insight was suddenly made available.
Copyright © 2002 XpertMart
* Return
to Catalogs *
* Return
to Table of Contents*