|
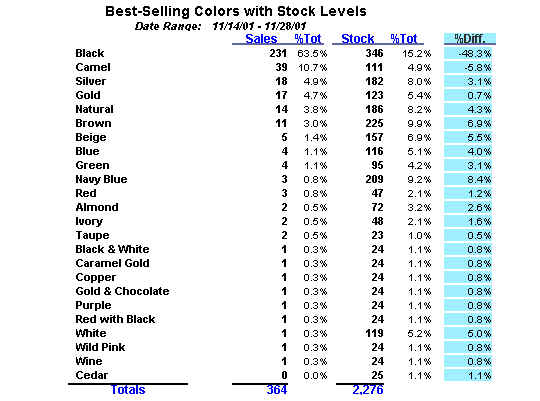
This report shows us which were the best-selling colors for
a sales period defined by the user. The sales of each color are aggregated
across styles and departments giving us a total figure. The colors are grouped
from most sold to least sold. For each color, we also see what percentage
of the total they represent. In the example shown below, 39 items with a
Camel color were sold in the period, representing 10.7% of total sales.
Press on the icon to
see a full-screen image
The report also includes aggregate stock levels for each color
and their proportional share of the total. For example, the report tells
us that there are currently 111 items in stock with a Camel color, representing
4.9% of our total inventory. There is another column that shows us the percentage
difference between a color's sales and a its stock levels. To continue with
our example, the color Camel represents 10.7% of our sales but only 4.9%
of our stock, a difference of -5.8%. This suggests that we are understocked
in this color. The goal is to bring the percentage difference between sales
and stock as close to zero as possible, so that we only carry inventory that
we know will sell. This report helps us monitor how well we are doing against
this goal.
Copyright © 2002
XpertMart
|

|


