| What's New | Why Inventory Control | Reports | Comparisons | Contact Us | |
| Smarter Retail | Why XpertMart | About the System | Size/Color Matirx | Support |

XpertReportsTM - Sizes Most Sold By Department with Stock Levels
This report ranks the sizes available in each department by sales and shows the available stock for each size for a given sales period. The sales and stock figures are aggregates of all the styles within a particular department. Reports like these that consolidate information at the department level can help us spot trends quickly, rather than have to wade through the data available for each particular style. We can then use the knowledge of these sales trends when we purchase additional merchandise. In the example below, we see that customer's buying Lady's Casual Sandals tend to favor slightly smaller sizes than those buying Lady's Dressy Boots.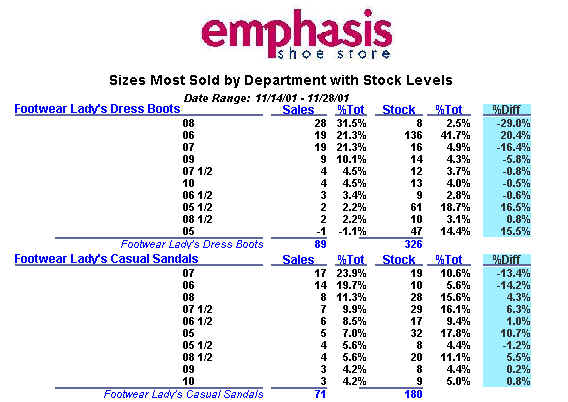
Press on the icon to see a full-screen
image
The report shows the number of items sold for each size within a department, and the the proportion of the total those sales represent. We see for example that 28 pairs of size 08 Lady's Dressy Boots were sold, representing 31.5% of the total. Similarly, we can see stock on hand and its' share of the total; in this case there are only 8 pairs of size 08 Lady's Dressy Boots, a mere 2.5% of the total. The % Diff. column alerts us to cases where sales and stock are out of balance, such as in this case where the difference between the proportion of sales and the proportion of stock is -29%. These types of reports can be made for a single store, the entire chain, or a subset of stores.
The report includes the store logo at the top. Logos, photos and other images can be included anywhere on a report.
Copyright © 2002 XpertMart