| What's New | Why Inventory Control | Reports | Comparisons | Contact Us | |
| Smarter Retail | Why XpertMart | About the System | Size/Color Matirx | Support |

XpertReportsTM - Best-Selling Styles by Department with Stock & Sales Matrix
For a given sales period, this report orders every Department from most sales to least sales. (There is a similar report that groups based on stock). In the example shown below, the department with the most items sold (843) during the month of November was Footwear Lady's Dressy Boots. This particular report is over 40 pages long (depends on the size of your database); on the following pages we would find that the second best-selling department is Footware Children's Sports Tennis and so on.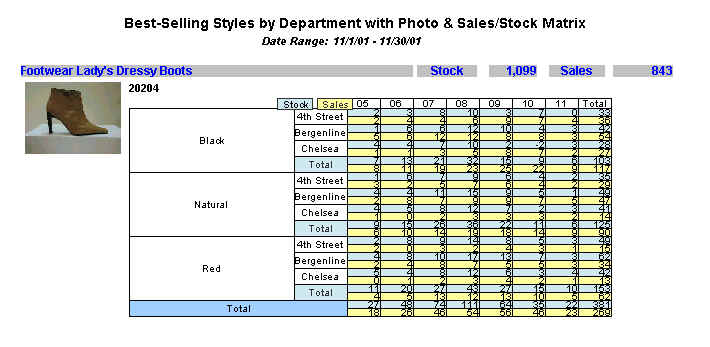
Press on the icon to see a full-screen
image
Within each department, this reports orders every style from most items sold to least items sold. In this case, style 20204 had the most sales (269) during the chosen period. On the following page would be style 19511 with 247 items sold and so on. Each style includes a photo (so we "see" which styles are the hot styles), and a store/size/color matrix that shows the stock and sales for each combination. By concentrating all of this information in one matrix, we can compare the behavior of sales trends for different colors, sizes and stores and see if we are overstocked or understocked in each case. We might learn, for example, that Black boots sell better than Red boots and that our Chelsea store seems to sell larger sizes than our 4th Street store.
Copyright © 2002 XpertMart